Re: Technische Analyse, daytrading en speculatie draad 2016
Posted: 24 Feb 2016, 16:26
by Spruitje
36.500€/kg
Re: Technische Analyse, daytrading en speculatie draad 2016
Posted: 02 Mar 2016, 16:30
by doubleyou
.
On Friday, gold experienced a “golden cross,” a technical indicator that occurs when an asset’s 50-day moving average crosses above its 200-day moving average. It’s the first such movement in nearly two years and is a sign that gold might have further to climb.
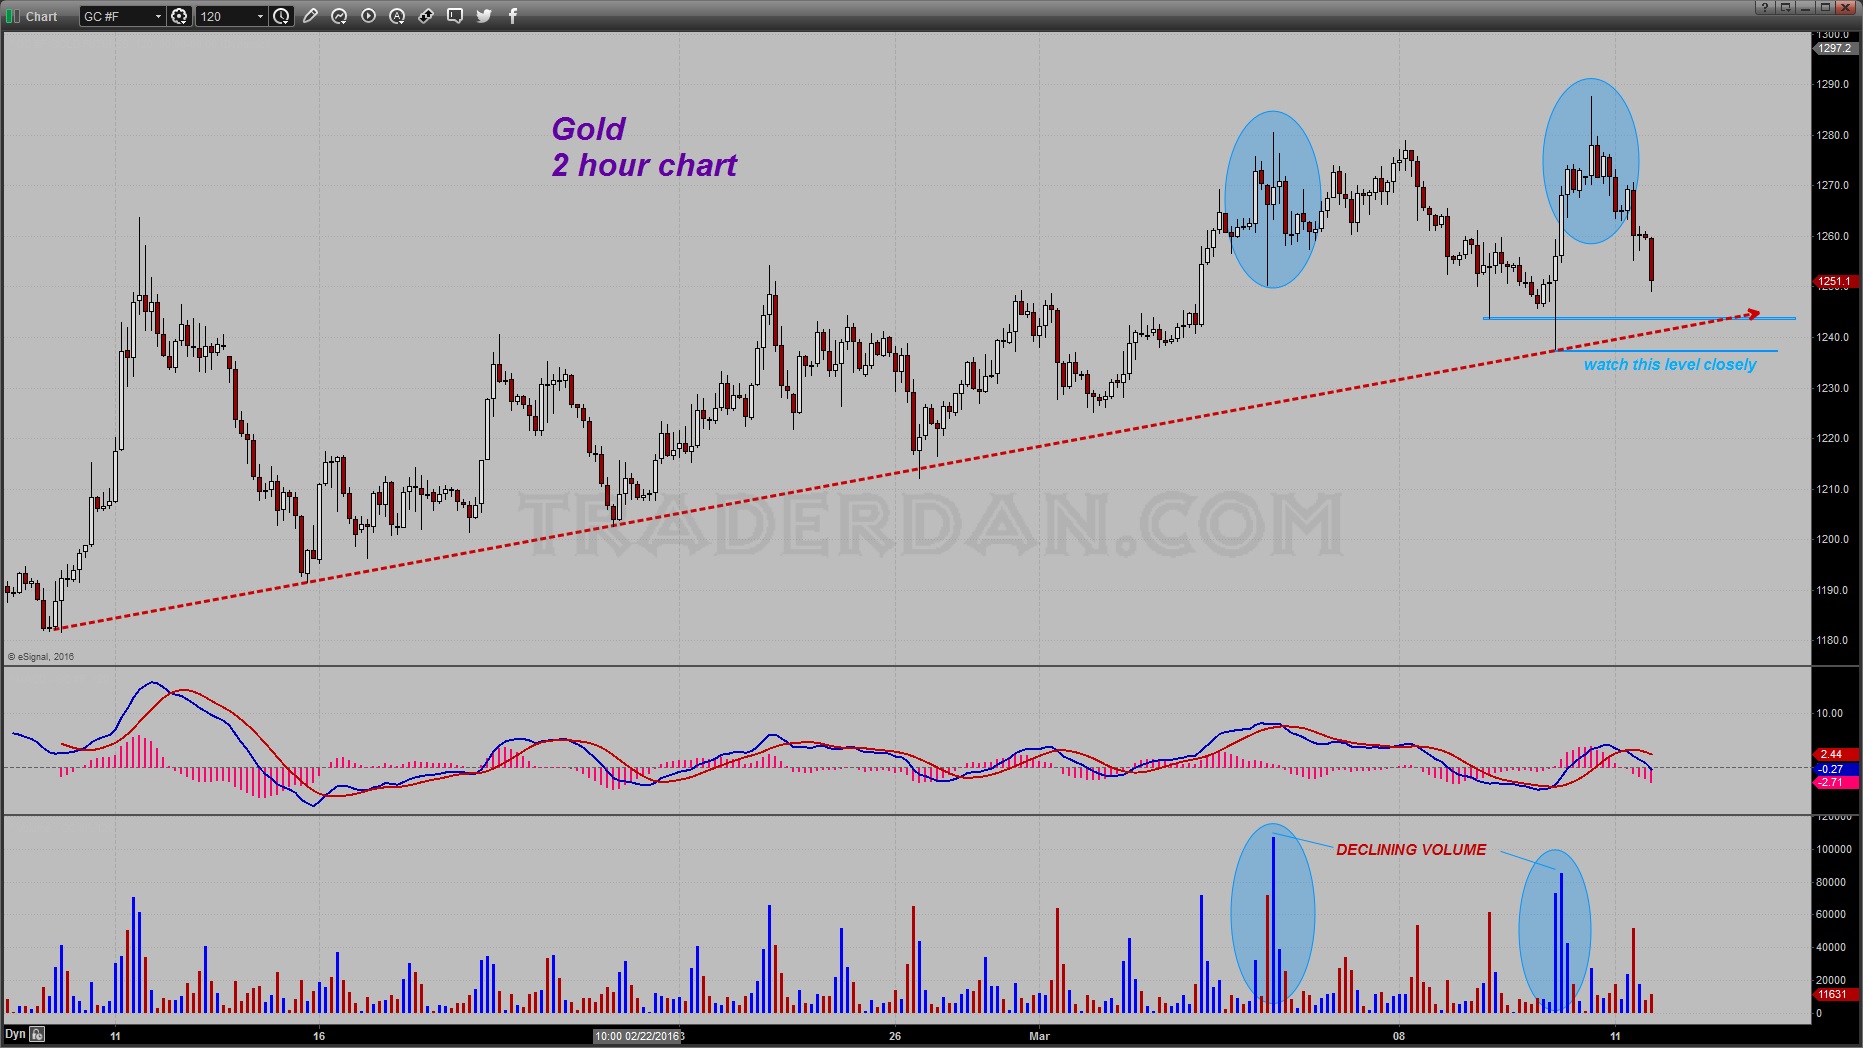
Here is a two hour chart of gold. Look at the surge in volume again. After being range bound between $1237-$1225 ahead of the report, the metal blew through the top of the range in short order and basically went vertical with barely a pause until it hit $1260 where it took a bit of a breather.
This thing now looks like it is going to try to test $1270 once more. It has garnered willing sellers above $1275 and has not been able to spend much time above that level before moving lower but that was before we knew how dovish the FOMC was. Whether or not that is a game changer is unclear but the Fed certainly did take one of the factors that would have been considered a negative away from gold with their statement today.
Re: Technische Analyse, daytrading en speculatie draad 2016
Posted: 17 Mar 2016, 22:04
by Adamus
'trying to test 1270' ......gemanipuleerd op klaarlichte dag all markets are rigged.
Re: Technische Analyse, daytrading en speculatie draad 2016